

Inovio Pharmaceuticals, Inc.
INO- Exchange
- Nasdaq
- Industry
- Pharmaceutical Preparations
- SEC CIK
- 0001055726
No open-market purchases or sales by Inovio Pharmaceuticals, Inc. insiders were filed in the last 90 days; 103 institutions reported holding it in 13F filings for Q2 2026, worth $36.1M in total; no superinvestor holds it.
Key figures
- Market capClose on Nov 11, 2026
- $276.3M
- Insider buysOpen market, last 90 days
- 0
- Insider sellsOpen market, last 90 days
- 0
- 13F holdersQ2 2026, +4 vs. previous quarter
- 103
- 13F valueReported value at the end of Q2 2026
- $36.1M
- Superinvestors holdingAt the end of Q2 2026
- 0
Price chart
Financials
See financial statementsFrom SEC filings, in USD.
- Revenue, FY2025
- $65.3K
- −70.0% year over year
- Net income, FY2025
- -$84.9M
- No comparable prior period
- Free cash flow, FY2025
- -$88.9M
- No comparable prior period
- Revenue, Q3 FY2026
- $298.9K
- No comparable prior period
Revenue flow, FY2025
Green is profit; orange is costs, expenses and taxes. Percentages are shares of revenue.
Net loss for FY2025: $84.9M (130000.0% of revenue).
Short interest
See short dataFrom FINRA, settlement date Oct 30, 2026.
- Short interest
- 22.1M
- Shares sold short
- Change
- +796.7K
- +3.7% vs. previous
- Days to cover
- 1.82
- At average daily volume
Superinvestors holding INO, Q2 2026
Go to the superinvestors tabNo superinvestor reported holding INO at the end of Q2 2026.
Latest insider trades
See all insider tradesOpen-market purchases and sales by Inovio Pharmaceuticals, Inc. insiders from Form 4, newest first.
| Filed (ET) | Trade date | Filing delay | Insider | Transaction | Shares | Avg price | Value | Holding change | Flags |
|---|---|---|---|---|---|---|---|---|---|
| Jun 5, 2023 (view filing) | Jun 5 | Same day | Zoth Lota S.Director | SSale | −5.70K | $0.56 | −$3.19K | −9.8%52.7K after | |
| Mar 13, 2023 (view filing) | Mar 13 | Same day | Weiner David B.Director | SSale | −5.83K | $1.15 | −$6.71K | −0.6%910.1K after | |
| Feb 28, 2023 (view filing) | Feb 27 | 1 day | Weiner David B.Director | SSale | −11.7K | $1.28 | −$14.9K | −1.3%904.3K after | |
| Aug 11, 2022 (view filing) | Aug 11 | Same day | Weiner David B.Director | SSale | −11.9K | $2.66 | −$31.6K | −1.3%892.6K after | |
| Jul 20, 2022 (view filing) | Jul 20 | Same day | Benito Simon XDirector | SSale | −2.00K | $2.25 | −$4.50K | −2.6%75.3K after | |
| May 17, 2022 (view filing) | May 16 | 1 day | Weiner David B.Director | SSale | −9.00K | $1.95 | −$17.6K | −1.0%892.6K after | |
| May 17, 2022 (view filing) | May 16 | 1 day | Zoth Lota S.Director | SSale | −3.60K | $1.98 | −$7.13K | −8.4%39.4K after | |
| Mar 17, 2022 (view filing) | Mar 16 | 1 day | Benito Simon XDirector | SSale | −2.00K | $3.16 | −$6.32K | −3.4%57.3K after | |
| Mar 14, 2022 (view filing) | Mar 14 | Same day | Weiner David B.Director | SSale | −4.08K | $3.20 | −$13.1K | −0.5%883.6K after | |
| Mar 9, 2022 (view filing) | Mar 9 | Same day | Weiner David B.Director | SSale | −4.08K | $3.33 | −$13.6K | −0.5%876.0K after |
Top 10 13F holders, Q2 2026
See all 103 holdersThe largest institutional positions in Inovio Pharmaceuticals, Inc. at the end of Q2 2026; share changes are against Q1 2026.
| Institution | Shares | Value | % of portfolio | Change in shares | Action |
|---|---|---|---|---|---|
| FMR LLC | 8,454,797 | $9.30M | 0.00% | −884,817−9.5% | Reduced |
| Jupiter Topco LLC | 5,171,053 | $5.71M | 0.00% | +5,171,053 | New |
| Vanguard Capital Management LLC | 3,650,562 | $4.02M | 0.00% | +749,354+25.8% | Added |
| Boxer Capital Management, LLC | 2,844,994 | $3.13M | 0.24% | +474,872+20.0% | Added |
| ADAR1 Capital Management, LLC | 2,143,910 | $2.36M | 0.11% | +673,802+45.8% | Added |
| D. E. Shaw & Co., Inc. | 1,351,656 | $1.49M | 0.00% | −861,163−38.9% | Reduced |
| Two Sigma Investments, LP | 1,239,778 | $1.36M | 0.00% | +849,394+217.6% | Added |
| Eversept Partners, LP | 1,035,360 | $1.14M | 0.06% | 00.0% | Unchanged |
| Geode Capital Management, LLC | 802,751 | $883.7K | 0.00% | +1,247+0.2% | Added |
| Millennium Management LLC | 796,107 | $875.7K | 0.00% | −614,738−43.6% | Reduced |
Holders of 5% or more of INO
See all 6 holders and filingsHolders whose latest Schedule 13D or 13G filing reports 5% or more of Inovio Pharmaceuticals, Inc..
| Holder | Latest form | Stake | Change | First filed | Latest filing | Filing |
|---|---|---|---|---|---|---|
| FMR LLC | 13G/A | 14.50%15.4M shares | +4.20 ppfrom 10.30% | Dec 5, 20254 filings | Nov 5, 2026 | SEC |
| Janus Henderson Group PLC | 13G/A | 9.99%6.67M shares | +3.79 ppfrom 6.20% | Nov 14, 20252 filings | Dec 8, 2025 | SEC |
| Ra Capital Management, L.P. | 13G | 9.90%10.7M shares | New | Aug 7, 20261 filing | Aug 7, 2026 | SEC |
| Highbridge Capital Management LLC | 13G/A | 8.20%6.19M shares | −1.00 ppfrom 9.20% | Feb 10, 20252 filings | May 15, 2026 | SEC |
| Alyeska Investment Group, L.P. | 13G/A | 5.99%4.00M shares | −1.54 ppfrom 7.53% | Nov 14, 20252 filings | Feb 17, 2026 | SEC |
Politician trades
All politician trades in INO1 member of Congress reported 1 trade in Inovio Pharmaceuticals, Inc. since 2020. Newest filings:
| Filed | Politician | Type | Amount |
|---|---|---|---|
| Nov 6, 2020 | 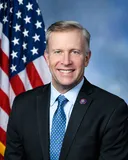 Chris Jacobs House · NY | Sell | $1K-$15K |
House · NY · Nov 6, 2020
Sell$1K-$15K