

Ubiquiti Inc.
UI- Exchange
- NYSE
- Industry
- Radio & Tv Broadcasting & Communications Equipment
- SEC CIK
- 0001511737
No open-market purchases or sales by Ubiquiti Inc. insiders were filed in the last 90 days; 360 institutions reported holding it in 13F filings for Q2 2026, worth $1.58B in total; no superinvestor holds it.
Key figures
- Market capClose on Nov 9, 2026
- $41.5B
- Insider buysOpen market, last 90 days
- 0
- Insider sellsOpen market, last 90 days
- 0
- 13F holdersQ2 2026, −24 vs. previous quarter
- 360
- 13F valueReported value at the end of Q2 2026
- $1.58B
- Superinvestors holdingAt the end of Q2 2026
- 0
Price chart
Financials
See financial statementsFrom SEC filings, in USD.
- Revenue, FY2026
- $3.27B
- +27.2% year over year
- Net income, FY2026
- $960.3M
- +34.9% year over year
- Free cash flow, FY2026
- $908.9M
- +44.9% year over year
- Revenue, Q1 FY2027
- $1.03B
- +39.9% year over year
Revenue flow, FY2026
Green is profit; orange is costs, expenses and taxes. Percentages are shares of revenue.
Short interest
See short dataFrom FINRA, settlement date Oct 15, 2026.
- Short interest
- 352.3K
- Shares sold short
- Change
- −19.1K
- −5.1% vs. previous
- Days to cover
- 3.54
- At average daily volume
Superinvestors holding UI, Q2 2026
Go to the superinvestors tabNo superinvestor reported holding UI at the end of Q2 2026.
Latest insider trades
See all insider tradesOpen-market purchases and sales by Ubiquiti Inc. insiders from Form 4, newest first.
| Filed (ET) | Trade date | Filing delay | Insider | Transaction | Shares | Avg price | Value | Holding change | Flags |
|---|---|---|---|---|---|---|---|---|---|
| May 15, 2026 (view filing) | May 13 | 2 days | Radigan KevinCHIEF ACCOUNTING OFFICER | SSale | −500 | $680.53 | −$340.3K | −18.1%2.27K after | |
| Nov 14, 2025 (view filing) | Nov 12 | 2 days | Radigan KevinCHIEF ACCOUNTING OFFICER | SSale | −350 | $576.58 | −$201.8K | −11.2%2.77K after | |
| Feb 14, 2025 (view filing) | Feb 12 | 2 days | Radigan KevinCHIEF ACCOUNTING OFFICER | SSale | −1.00K | $347.99 | −$348.0K | −28.7%2.48K after | |
| Sep 6, 2022 (view filing) | Sep 6 | Same day | Sege RonaldDirector | SSale | −2.11K | $300.80 | −$635.3K | −100.0%0 after | |
| May 20, 2022 (view filing) | May 18 | 2 days | Sege RonaldDirector | SSale | −2.11K | $246.98 | −$521.6K | −100.0%0 after | |
| Feb 22, 2022 (view filing) | Feb 18 | 4 days | Sege RonaldDirector | SSale | −2.11K | $247.71 | −$523.2K | −100.0%0 after | |
| Nov 15, 2021 (view filing) | Nov 15 | Same day | Sege RonaldDirector | SSale | −1.58K | $304.53 | −$482.4K | −100.0%0 after | |
| Sep 3, 2021 (view filing) | Sep 3 | Same day | Sege RonaldDirector | SSale | −1.58K | $329.31 | −$521.6K | −100.0%0 after |
Top 10 13F holders, Q2 2026
See all 360 holdersThe largest institutional positions in Ubiquiti Inc. at the end of Q2 2026; share changes are against Q1 2026.
| Institution | Shares | Value | % of portfolio | Change in shares | Action |
|---|---|---|---|---|---|
| BlackRock, Inc. | 305,245 | $163.0M | 0.00% | +10,691+3.6% | Added |
| Renaissance Technologies LLC | 198,344 | $105.9M | 0.15% | −20,600−9.4% | Reduced |
| SW Investment Management LLC | 140,000 | $74.8M | 21.26% | −2,500−1.8% | Reduced |
| Capital World Investors | 113,839 | $60.8M | 0.01% | +6,224+5.8% | Added |
| State Street Corp | 101,663 | $54.3M | 0.00% | +16,198+19.0% | Added |
| Arrowstreet Capital, Limited Partnership | 91,450 | $48.8M | 0.02% | −92,114−50.2% | Reduced |
| Geode Capital Management, LLC | 74,029 | $39.5M | 0.00% | −1,412−1.9% | Reduced |
| Goldman Sachs Group Inc | 69,500 | $37.1M | 0.00% | −7,435−9.7% | Reduced |
| Morgan Stanley | 68,963 | $36.8M | 0.00% | −8,986−11.5% | Reduced |
| AQR Capital Management LLC | 67,472 | $36.0M | 0.01% | −61,731−47.8% | Reduced |
Politician trades
All politician trades in UI2 members of Congress reported 5 trades in Ubiquiti Inc. since 2020. Newest filings:
| Filed | Politician | Type | Amount |
|---|---|---|---|
| Aug 5, 2026 | 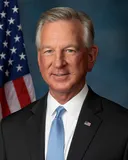 Tommy Tuberville Senate · AL | Sell (full) | $1K-$15K |
| May 19, 2023 | 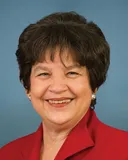 Lois Frankel House · FL | Sell (partial) | $1K-$15K |
| May 19, 2023 | Lois Frankel House · FL | Sell | $1K-$15K |
| Oct 24, 2022 | Lois Frankel House · FL | Sell (partial) | $1K-$15K |
| Oct 24, 2022 | Lois Frankel House · FL | Sell (partial) | $1K-$15K |
Senate · AL · Aug 5, 2026
Sell (full)$1K-$15K
House · FL · May 19, 2023
Sell (partial)$1K-$15K
House · FL · May 19, 2023
Sell$1K-$15K
House · FL · Oct 24, 2022
Sell (partial)$1K-$15K
House · FL · Oct 24, 2022
Sell (partial)$1K-$15K